 : Network Scanning")
The next phase of Ethical hacking is Network scanning. It this phase We need to get more information about networks such as live devices, port status(open or closed), operating systems type, used the application, running services and etc. To collect that information hackers use the network scanning methodology:
- Look for live systems
- Port discovery
- Evading IDS
- Banner Grabbing or OS fingerprinting
- Scan the network for vulnerabilities
- Use Proxies
- Idle Scan
- Make a network diagram
- NMAP security scanner
- SCAPY packet manipulation tool
- HPING3 packet analyzer tools
Look for live systems: ICMP Echo scanning is used for identifying active devices. The response of that identifies host/device live or not. For example, Host 1 – 172.16.171.3 sends an ICMP echo request to the target host 2 – 172.16.171.21. If the response is an ICMP reply, then you know the target is alive.
C:\Users\user>ping 172.16.171.21
 Pinging 172.16.171.21 with 32 bytes of data:
 Reply from 172.16.171.21: bytes=32 time<1ms TTL=128
 Reply from 172.16.171.21: bytes=32 time<1ms TTL=128
 Reply from 172.16.171.21: bytes=32 time<1ms TTL=128
 Reply from 172.16.171.21: bytes=32 time<1ms TTL=128
 Ping statistics for 172.16.171.21:
     Packets: Sent = 4, Received = 4, Lost = 0 (0% loss),
 Approximate round trip times in milli-seconds:
     Minimum = 0ms, Maximum = 0ms, Average = 0ms
Otherwise, the host is not alive or ICMP pings are being blocked by firewalls:
C:\Users\user>ping 172.16.171.212
 Pinging 172.16.171.212 with 32 bytes of data:
 Reply from 172.16.171.134: Destination host unreachable.
 Reply from 172.16.171.134: Destination host unreachable.
 Reply from 172.16.171.134: Destination host unreachable.
 Reply from 172.16.171.134: Destination host unreachable.
 Ping statistics for 172.16.171.212:
     Packets: Sent = 4, Received = 4, Lost = 3 (0% loss)
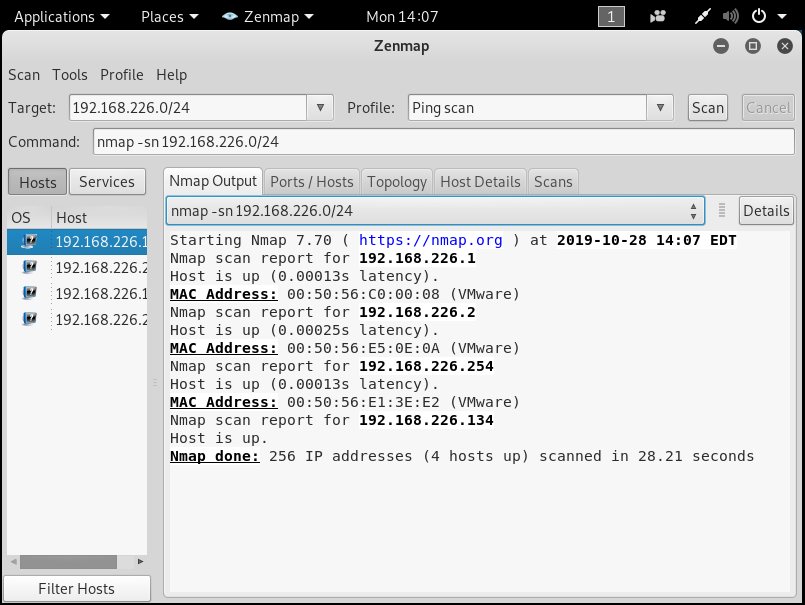
A ping sweep is used to determine the range of IP addresses that are mapped to active hosts. It allows hackers to calculate subnet masks and identify the number of present hosts in the subnet. There are a lot of tools for Ping Sweep like Advanced IP Scanner, Zenmap on Kali Linux and etc. For example, with Zenmap:
Port discovery: Hackers scanning network different ports to find vulnerabilities. There a lot of tools for that, but most using of them is Nmap. Nmap (network mapper) is open-source software and can be used to collect network information such as what services are being run and their version number, the operating systems being used and etc.
We will try some of the popular scanning methods that can be used to scan ports with Nmap:
# Scan single port
root@thehackertips:~# nmap -p 80 192.168.226.134
Starting Nmap 7.70 ( https://nmap.org ) at 2019-10-28 14:59 EDT
Nmap scan report for 192.168.226.134
Host is up (0.000055s latency).

PORT   STATE  SERVICE
80/tcp closed http

Nmap done: 1 IP address (1 host up) scanned in 13.14 seconds
# Scan the range of ports
root@thehackertips:~# nmap -p 20-60 192.168.226.134
Starting Nmap 7.70 ( https://nmap.org ) at 2019-10-28 15:01 EDT
Nmap scan report for 192.168.226.134
Host is up (0.000060s latency).
Not shown: 40 closed ports
PORT   STATE SERVICE
22/tcp open  ssh

Nmap done: 1 IP address (1 host up) scanned in 13.31 seconds
# Scan the first 100 ports
root@thehackertips:~# nmap -F 192.168.226.134
Starting Nmap 7.70 ( https://nmap.org ) at 2019-10-28 15:04 EDT
Nmap scan report for 192.168.226.134
Host is up (0.000013s latency).
Not shown: 99 closed ports
PORT   STATE SERVICE
22/tcp open  ssh
Nmap done: 1 IP address (1 host up) scanned in 13.21 seconds
# Scan using TCP Handshake
root@thehackertips:~# nmap -sT 192.168.226.134
Starting Nmap 7.70 ( https://nmap.org ) at 2019-10-28 15:26 EDT
Nmap scan report for 192.168.226.134
Host is up (0.00050s latency).
Not shown: 999 closed ports
PORT   STATE SERVICE
22/tcp open  ssh
Nmap done: 1 IP address (1 host up) scanned in 13.18 seconds
# Scan all UDP port
root@thehackertips:~# nmap -sU 192.168.226.134
# Scan UDP port 53
root@thehackertips:~# nmap -sU -p 53 192.168.226.134
Starting Nmap 7.70 ( https://nmap.org ) at 2019-10-28 16:26 EDT
Nmap scan report for 192.168.226.134
Host is up (0.086s latency).
PORT     STATE         SERVICE
53/udp open|filtered unknown
Nmap done: 1 IP address (1 host up) scanned in 1.53 seconds
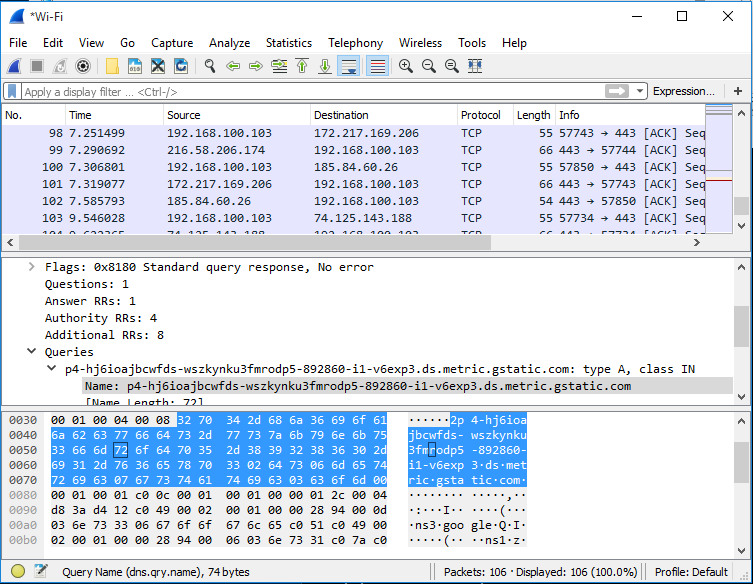
Wireshark is a great tool to use while learning Nmap, It is recommended to run Wireshark while using Nmap, following the flow of network traffic will help you analyze and visuals the scans.
Another network scanning tool is Unicornscan. It has many features like as:
- TCP scanning
- TCP banner grabbing
- UDP Scanning
- Active and Passive scan application, remote operation system and etc.
- PCAP file logging and filtering.
- and etc.
You can type the command as follow to get help.
root@thehackertips:~# unicornscan -h
unicornscan (version 0.4.7)
usage: unicornscan [options `b:B:cd:De:EFG:hHi:Ij:l:L:m:M:o:p:P:q:Qr:R:s:St:T:u:Uw:W:vVzZ:' ] X.X.X.X/YY:S-E
    -b, --broken-crc     *set broken crc sums on [T]ransport layer, [N]etwork layer, or both[TN]
    -B, --source-port    *set source port? or whatever the scan module expects as a number
    -c, --proc-duplicates process duplicate replies
    -d, --delay-type     *set delay type (numeric value, valid options are `1:tsc 2:gtod 3:sleep')
    -D, --no-defpayload   no default Payload, only probe known protocols
    -e, --enable-module  *enable modules listed as arguments (output and report currently)
    -E, --proc-errors     for processing `non-open' responses (icmp errors, tcp rsts...)
    -F, --try-frags
    -G, --payload-group *payload group (numeric) for tcp/udp type payload selection (default all)
    -h, --help            help
    -H, --do-dns          resolve hostnames during the reporting phase
    -i, --interface      *interface name, like eth0 or fxp1, not normally required
    -I, --immediate       immediate mode, display things as we find them
    -j, --ignore-seq     *ignore `A'll, 'R'eset sequence numbers for tcp header validation
    -l, --logfile        *write to this file not my terminal
    -L, --packet-timeout *wait this long for packets to come back (default 7 secs)
    -m, --mode           *scan mode, tcp (syn) scan is default, U for udp T for tcp `sf' for tcp connect scan and A for arp
                           for -mT you can also specify tcp flags following the T like -mTsFpU for example
                           that would send tcp syn packets with (NO Syn|FIN|NO Push|URG)
    -M, --module-dir     *directory modules are found at (defaults to /usr/lib/unicornscan/modules)
    -o, --format         *format of what to display for replies, see man page for format specification
    -p, --ports           global ports to scan, if not specified in target options
    -P, --pcap-filter    *extra pcap filter string for reciever
    -q, --covertness     *covertness value from 0 to 255
    -Q, --quiet           dont use output to screen, its going somewhere else (a database say...)
    -r, --pps            *packets per second (total, not per host, and as you go higher it gets less accurate)
    -R, --repeats        *repeat packet scan N times
    -s, --source-addr    *source address for packets `r' for random
    -S, --no-shuffle      do not shuffle ports
    -t, --ip-ttl         *set TTL on sent packets as in 62 or 6-16 or r64-128
    -T, --ip-tos         *set TOS on sent packets
    -u, --debug     *debug mask
    -U, --no-openclosed  dont say open or closed
    -w, --safefile       *write pcap file of recieved packets
    -W, --fingerprint    *OS fingerprint 0=cisco(def) 1=openbsd 2=WindowsXP 3=p0fsendsyn 4=FreeBSD 5=nmap
                          6=linux 7:strangetcp
    -v, --verbose         verbose (each time more verbose so -vvvvv is really verbose)
    -V, --version         display version
    -z, --sniff           sniff alike
    -Z, --drone-str      *drone String
*:  options with `*' require an argument following them

  address ranges are cidr like 1.2.3.4/8 for all of 1.?.?.?
  if you omit the cidr mask then /32 is implied
  port ranges are like 1-4096 with 53 only scanning one port, a for all 65k and p for 1-1024
example: unicornscan -i eth1 -Ir 160 -E 192.168.1.0/24:1-4000 gateway:a
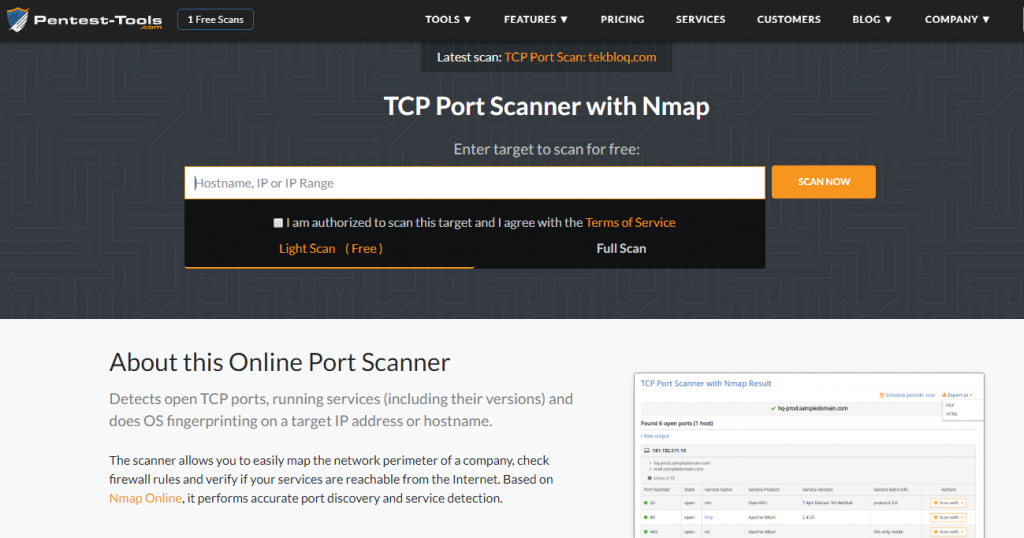
There are many online tools for port scanning. One of them is https://pentest-tools.com/ .
Evading IDS: An Intrusion Detection System (IDS) is a device or software application that monitors network or system activities for malicious activities or policy violations. An IDS inspects all inbound and outbound network traffic. To Evading IDS possible and Hacker send some packet to IDS and IDS believes and accepts the packet. The attacker uses fragmentation and small packets to evade IDS. This packet sent using compromised or proxy machines.
Banner Grabbing or OS fingerprinting is determining what is the service or services running on the target machine, also for discovering the type or/and version of the software/operating system on the target machine. There are many tools for this. Some of them are telnet, Netcraft, Netcat, Xprobe, Maltego, nmap and etc.
For example, with Nmap, We can determine the operating system.
root@thehackertips:~# nmap -O 192.168.226.131
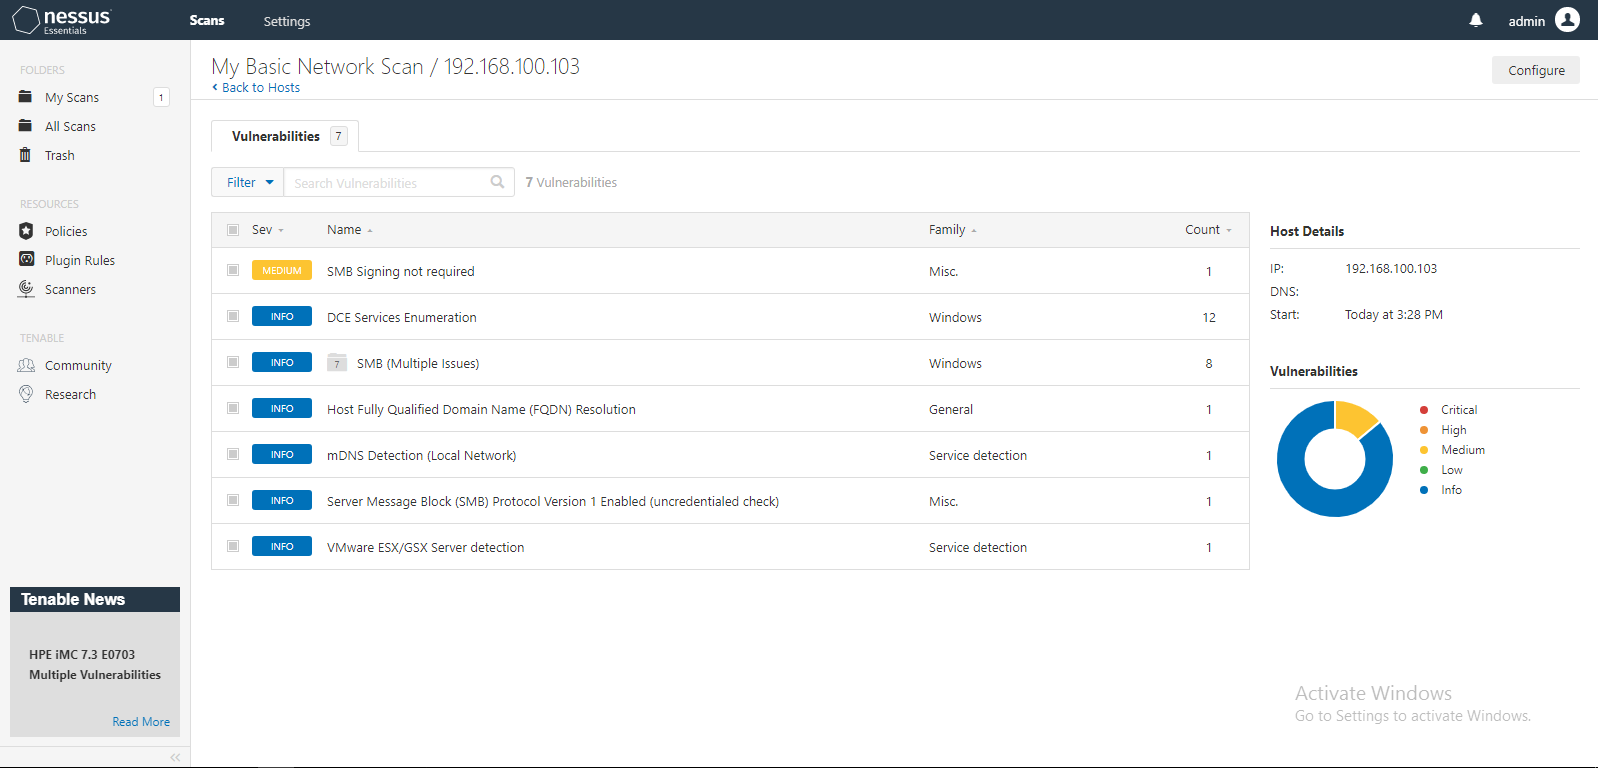
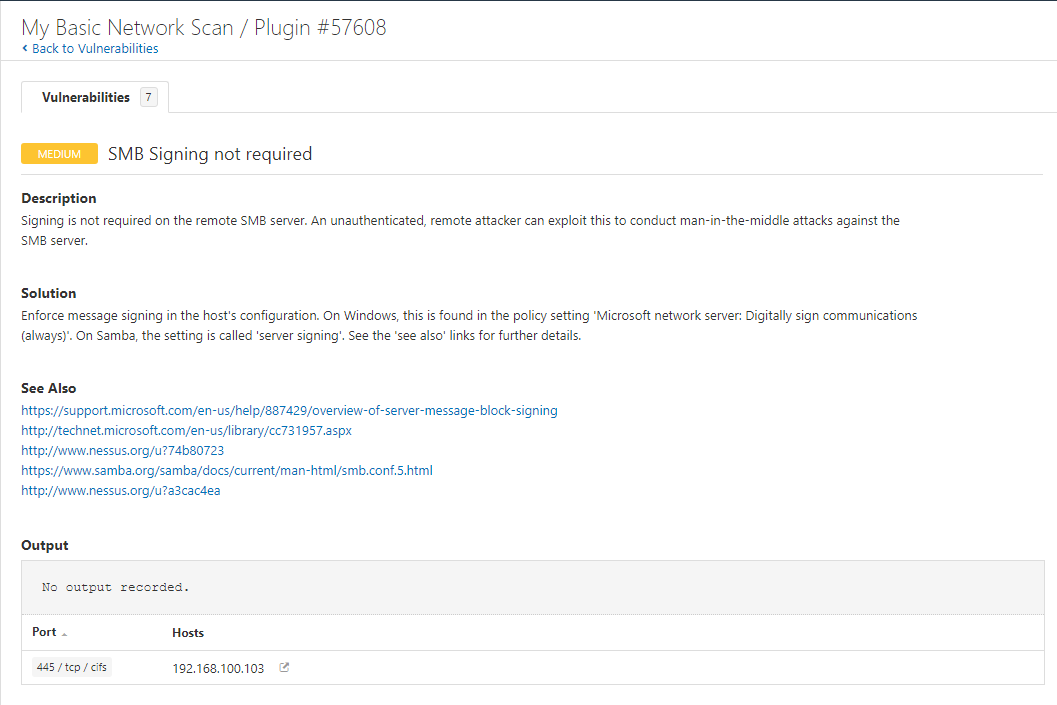
Scan the network for vulnerabilities helps to identify app, service, and system running on the target machine and collect information about vulnerabilities. One of the powerful tools for vulnerability assessment is Nessus which is the product of tenable.com. The product has a free version and You can use it up to 16 IPs. For example, Below pictures scanned target host and found “SMB Signing not required” vulnerability:
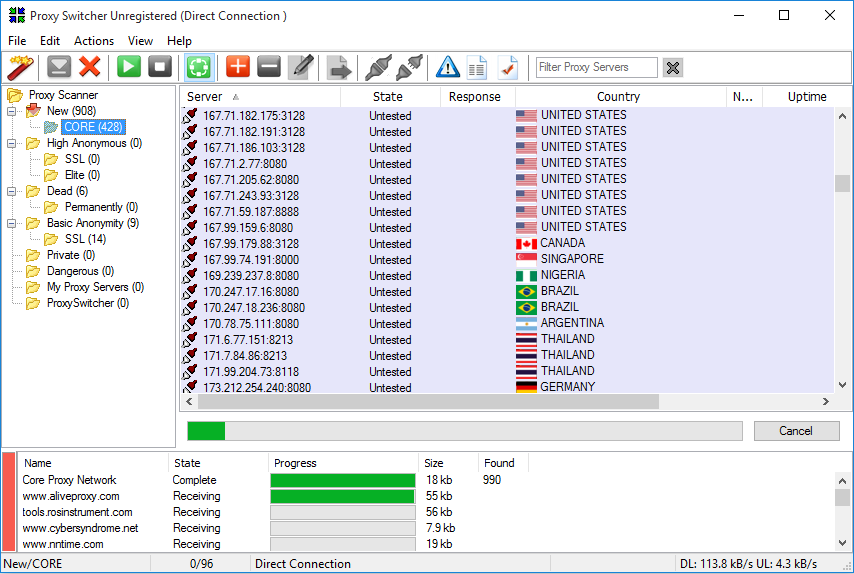
Use Proxies: Proxies are the system that stands between attacker and target. When the attacker sends a request to the target, request sent/received through the proxy and hide the IP address of the attacker. Sometimes an attacker can use multiple proxies and it is called Proxy Chaining. There are many tools for proxy like as:
- Proxy Switcher helps to hide your IP address, automatic proxy server switching for improved anonymous surfing.
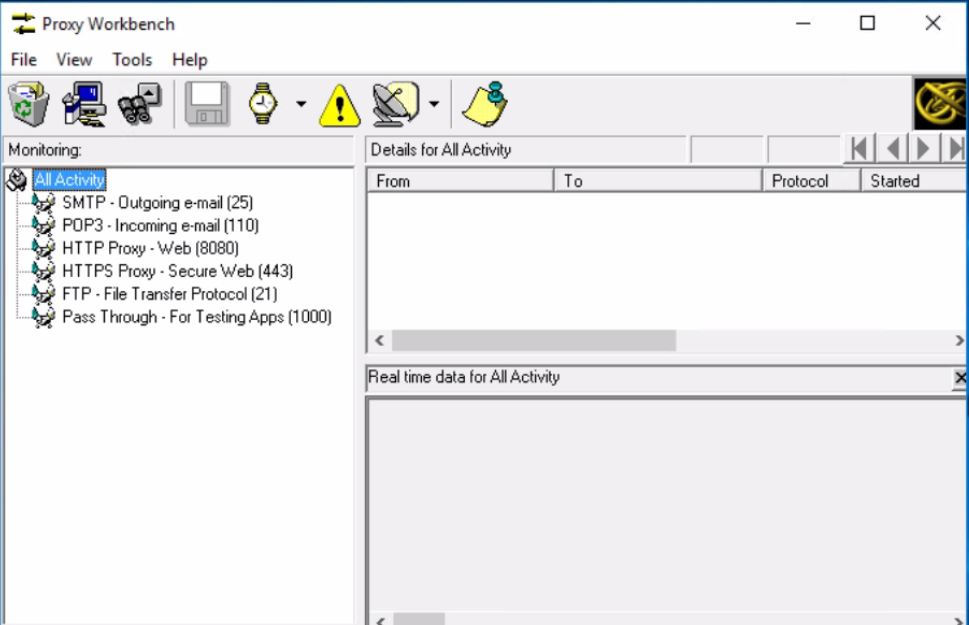
- Proxy Workbench is a unique proxy server ideal security experts that display its data in real-time.
Idle Scan is the best way to identify port status on the target machine. As we know normally when we sent SYN packet to the open port on the target machine, the target machine replies back SYN+ACK if the port is open. IF port closed replies back RST packet. Every packet has its IPID number and it is increasing with increments.
The Idle Scan proceed 3 steps: 1. Find and send a packet to zombie 2.send spoofed packets 3. send a packet to zombie again.
- The 1st steps Attacker finds zombie and sends SYN+ACK packet and then Zombie machine will reply back RST with IPID number (1001).
- 2nd steps send a spoofed SYN packet to the target machine with zombie IP addreses. If the port is open target machine replies to the SYN+ACK packet to the zombie, then zombie replies back to the target machine with IPID number (1002) RST packet; If the port is closed/filtered target reply RST packet to a zombie.
- 3rd step we send the SYN+ACK packet and then the Zombie machine. If the port was open Zombie machine reply back RST with IPID number (1003) otherwise we get the RST packet with IPID number (1002) and it means that port closed or filtered.
With Nmap, we can do Idle scan with command as below:
root@thehackertips:~# nmap -Pn -sI 192.168.223.136 192.168.223.222
# 192.168.223.136 - Zombie IP address
# 192.168.223.222 - Target IP address
#  -sI  - Idle scan
#  -Pn  - skip host discovery, it is necessary for stealth, otherwise ping #packets would be sent to the target from Attacker's real address

# Specify port range as below
root@thehackertips:~# nmap -Pn -sI 192.168.223.136  -P1-90 --packet-trace 192.168.223.222
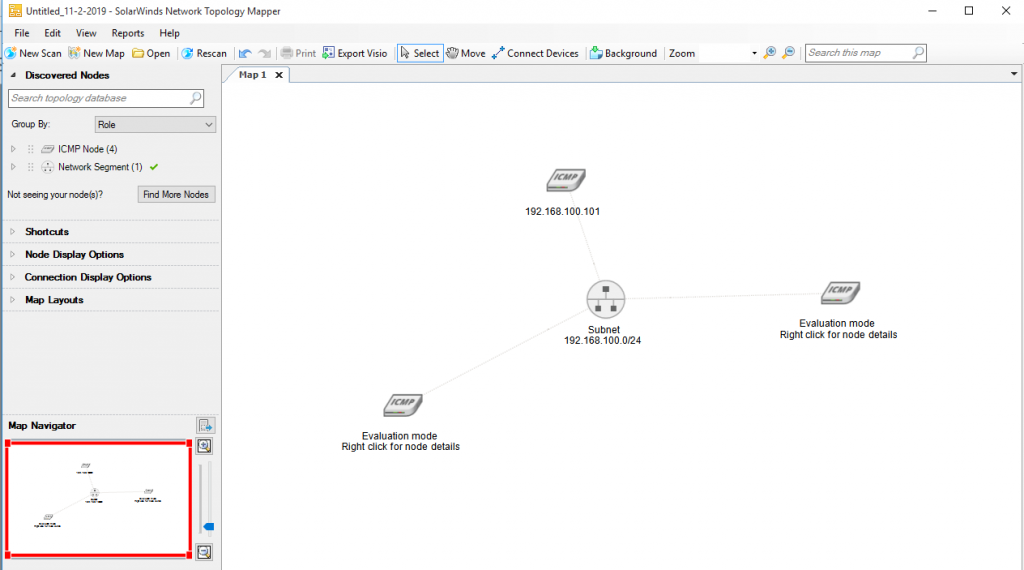
Make a network diagram: To understand network topology we need to draw its diagram. There are many tools for this purpose and the best of them are network topology mapper(SolarWinds) and Opmanager(ManageEngine). These tools scan the network and create a topology view of that. For example:
NMAP security scanner: Nmap (Network Mapper) is a free and open-source utility for network discovery and security auditing. The graphical format of Nmap is Zenmap. Nmap and Zenmap are available in several versions and formats. You can download that from this link if you want to use that other operating system.
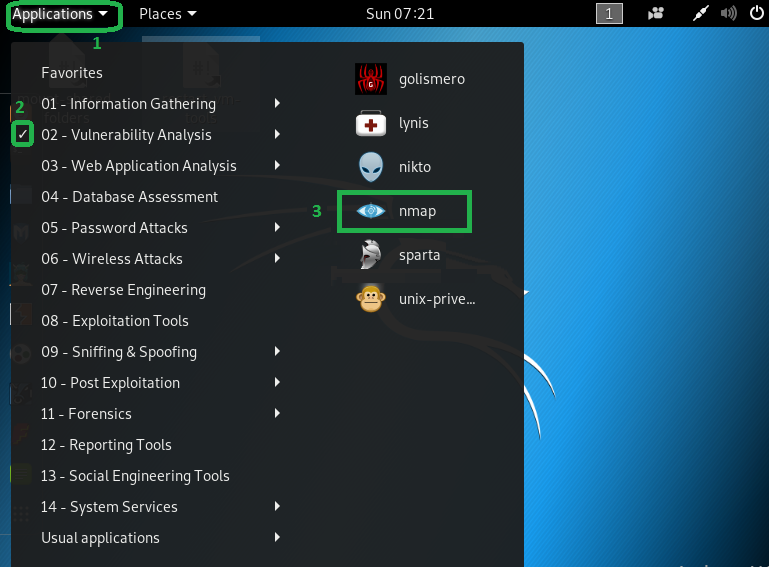
Let’s open Nmap on Kali Linux and do some examples.
To get help about Nmap using the command as follow:
root@thehackertips:~# nmap --help
 Nmap 7.70 ( https://nmap.org )
 Usage: nmap [Scan Type(s)] [Options] {target specification}
 TARGET SPECIFICATION:
   Can pass hostnames, IP addresses, networks, etc.
   Ex: scanme.nmap.org, microsoft.com/24, 192.168.0.1; 10.0.0-255.1-254
   -iL : Input from list of hosts/networks
   -iR : Choose random targets
   --exclude : Exclude hosts/networks
   --excludefile : Exclude list from file
 HOST DISCOVERY:
   -sL: List Scan - simply list targets to scan
   -sn: Ping Scan - disable port scan
   -Pn: Treat all hosts as online -- skip host discovery
   -PS/PA/PU/PY[portlist]: TCP SYN/ACK, UDP or SCTP discovery to given ports
   -PE/PP/PM: ICMP echo, timestamp, and netmask request discovery probes
   -PO[protocol list]: IP Protocol Ping
   -n/-R: Never do DNS resolution/Always resolve [default: sometimes]
   --dns-servers : Specify custom DNS servers
   --system-dns: Use OS's DNS resolver
   --traceroute: Trace hop path to each host
 SCAN TECHNIQUES:
   -sS/sT/sA/sW/sM: TCP SYN/Connect()/ACK/Window/Maimon scans
   -sU: UDP Scan
   -sN/sF/sX: TCP Null, FIN, and Xmas scans
   --scanflags : Customize TCP scan flags
   -sI : Idle scan
   -sY/sZ: SCTP INIT/COOKIE-ECHO scans
   -sO: IP protocol scan
   -b : FTP bounce scan
 PORT SPECIFICATION AND SCAN ORDER:
   -p : Only scan specified ports
     Ex: -p22; -p1-65535; -p U:53,111,137,T:21-25,80,139,8080,S:9
   --exclude-ports : Exclude the specified ports from scanning
   -F: Fast mode - Scan fewer ports than the default scan
   -r: Scan ports consecutively - don't randomize
   --top-ports : Scan  most common ports
   --port-ratio : Scan ports more common than
 SERVICE/VERSION DETECTION:
   -sV: Probe open ports to determine service/version info
   --version-intensity : Set from 0 (light) to 9 (try all probes)
   --version-light: Limit to most likely probes (intensity 2)
   --version-all: Try every single probe (intensity 9)
   --version-trace: Show detailed version scan activity (for debugging)
 SCRIPT SCAN:
   -sC: equivalent to --script=default
   --script=:  is a comma separated list of
            directories, script-files or script-categories
   --script-args=: provide arguments to scripts
   --script-args-file=filename: provide NSE script args in a file
   --script-trace: Show all data sent and received
   --script-updatedb: Update the script database.
   --script-help=: Show help about scripts.
             is a comma-separated list of script-files or
            script-categories.
 OS DETECTION:
   -O: Enable OS detection
   --osscan-limit: Limit OS detection to promising targets
   --osscan-guess: Guess OS more aggressively
 TIMING AND PERFORMANCE:
   Options which take  are in seconds, or append 'ms' (milliseconds),
   's' (seconds), 'm' (minutes), or 'h' (hours) to the value (e.g. 30m).
   -T<0-5>: Set timing template (higher is faster)
   --min-hostgroup/max-hostgroup : Parallel host scan group sizes
   --min-parallelism/max-parallelism : Probe parallelization
   --min-rtt-timeout/max-rtt-timeout/initial-rtt-timeout : Specifies
       probe round trip time.
   --max-retries : Caps number of port scan probe retransmissions.
   --host-timeout : Give up on target after this long
   --scan-delay/--max-scan-delay : Adjust delay between probes
   --min-rate : Send packets no slower than  per second
   --max-rate : Send packets no faster than  per second
 FIREWALL/IDS EVASION AND SPOOFING:
   -f; --mtu : fragment packets (optionally w/given MTU)
   -D : Cloak a scan with decoys
   -S : Spoof source address
   -e : Use specified interface
   -g/--source-port : Use given port number
   --proxies : Relay connections through HTTP/SOCKS4 proxies
   --data : Append a custom payload to sent packets
   --data-string : Append a custom ASCII string to sent packets
   --data-length : Append random data to sent packets
   --ip-options : Send packets with specified ip options
   --ttl : Set IP time-to-live field
   --spoof-mac : Spoof your MAC address
   --badsum: Send packets with a bogus TCP/UDP/SCTP checksum
 OUTPUT:
   -oN/-oX/-oS/-oG : Output scan in normal, XML, s|: Output in the three major formats at once
   -v: Increase verbosity level (use -vv or more for greater effect)
   -d: Increase debugging level (use -dd or more for greater effect)
   --reason: Display the reason a port is in a particular state
   --open: Only show open (or possibly open) ports
   --packet-trace: Show all packets sent and received
   --iflist: Print host interfaces and routes (for debugging)
   --append-output: Append to rather than clobber specified output files
   --resume : Resume an aborted scan
   --stylesheet : XSL stylesheet to transform XML output to HTML
   --webxml: Reference stylesheet from Nmap.Org for more portable XML
   --no-stylesheet: Prevent associating of XSL stylesheet w/XML output
 MISC:
   -6: Enable IPv6 scanning
   -A: Enable OS detection, version detection, script scanning, and traceroute
   --datadir : Specify custom Nmap data file location
   --send-eth/--send-ip: Send using raw ethernet frames or IP packets
   --privileged: Assume that the user is fully privileged
   --unprivileged: Assume the user lacks raw socket privileges
   -V: Print version number
   -h: Print this help summary page.
 EXAMPLES:
   nmap -v -A scanme.nmap.org
   nmap -v -sn 192.168.0.0/16 10.0.0.0/8
   nmap -v -iR 10000 -Pn -p 80
 SEE THE MAN PAGE (https://nmap.org/book/man.html) FOR MORE OPTIONS AND EXAMPLES
The basic form of Nmap is:
root@thehackertips:~# nmap 192.168.226.1
Starting Nmap 7.70 ( https://nmap.org ) at 2019-11-03 08:28 EST
Nmap scan report for 192.168.226.1
Host is up (0.00050s latency).
Not shown: 989 filtered ports
PORT     STATE SERVICE
135/tcp  open  msrpc
139/tcp  open  netbios-ssn
443/tcp  open  https
445/tcp  open  microsoft-ds
902/tcp  open  iss-realsecure
912/tcp  open  apex-mesh
1801/tcp open  msmq
2103/tcp open  zephyr-clt
2105/tcp open  eklogin
2107/tcp open  msmq-mgmt
5357/tcp open  wsdapi
MAC Address: 00:50:56:C0:00:08 (VMware)
Nmap done: 1 IP address (1 host up) scanned in 17.95 seconds
# For all subnet
root@thehackertips:~# nmap 192.168.226.1-254
root@thehackertips:~# nmap 192.168.226.0/254
Looks for devices responding to a PING on Nmap:
 root@thehackertips:~# nmap -sP 192.168.226.1
 Starting Nmap 7.70 ( https://nmap.org ) at 2019-11-03 08:33 EST
 Nmap scan report for 192.168.226.1
 Host is up (0.00032s latency).
 MAC Address: 00:50:56:C0:00:08 (VMware)
 Nmap done: 1 IP address (1 host up) scanned in 13.09 seconds
 root@thehackertips:~# nmap -sP 192.168.226.0/24
 Starting Nmap 7.70 ( https://nmap.org ) at 2019-11-03 08:33 EST
 Nmap scan report for 192.168.226.1
 Host is up (0.00036s latency).
 MAC Address: 00:50:56:C0:00:08 (VMware)
 Nmap scan report for 192.168.226.2
 Host is up (0.00016s latency).
 MAC Address: 00:50:56:E5:0E:0A (VMware)
 Nmap scan report for 192.168.226.129
 Host is up (0.0014s latency).
 MAC Address: 00:0C:29:FA:DD:2A (VMware)
 Nmap scan report for 192.168.226.254
 Host is up (0.00015s latency).
 MAC Address: 00:50:56:FE:A9:A2 (VMware)
 Nmap scan report for 192.168.226.134
 Host is up.
 Nmap done: 256 IP addresses (5 hosts up) scanned in 27.78 seconds
# Here -sP Ping Scan
You can use PING scan for all IP range as follow:
nmap -sP 192.168.226.1-254
or
nmap -sP 192.168.226.0/24
With Nmap We can detect OS details as follow:
root@thehackertips:~# nmap -O 192.168.226.1
Starting Nmap 7.70 ( https://nmap.org ) at 2019-11-03 08:41 EST
Nmap scan report for 192.168.226.1
Host is up (0.00036s latency).
Not shown: 989 filtered ports
PORT     STATE SERVICE
135/tcp  open  msrpc
139/tcp  open  netbios-ssn
443/tcp  open  https
445/tcp  open  microsoft-ds
902/tcp  open  iss-realsecure
912/tcp  open  apex-mesh
1801/tcp open  msmq
2103/tcp open  zephyr-clt
2105/tcp open  eklogin
2107/tcp open  msmq-mgmt
5357/tcp open  wsdapi
MAC Address: 00:50:56:C0:00:08 (VMware)
Warning: OSScan results may be unreliable because we could not find at least 1 open and 1 closed port
Aggressive OS guesses: Microsoft Windows 10 1511 - 1607 (95%), Microsoft Windows Phone 7.5 or 8.0 (94%), Microsoft Windows 10 1607 (93%), Microsoft Windows 10 1511 (93%), Microsoft Windows Server 2008 R2 or Windows 8.1 (93%), Microsoft Windows Server 2016 (93%), Microsoft Windows Vista SP0 or SP1, Windows Server 2008 SP1, or Windows 7 (93%), Microsoft Windows Embedded Standard 7 (93%), Microsoft Windows Vista SP2, Windows 7 SP1, or Windows Server 2008 (93%), Microsoft Windows 7 Professional or Windows 8 (92%)
No exact OS matches for host (test conditions non-ideal).
Network Distance: 1 hop
OS detection performed. Please report any incorrect results at https://nmap.org/submit/ .
Nmap done: 1 IP address (1 host up) scanned in 23.10 seconds
If you want to get the version information about the port command will be as follow:
root@thehackertips:~# nmap -sV -O 192.168.226.1                                                                                                                                                      Starting Nmap 7.70 ( https://nmap.org ) at 2019-11-03 08:46 EST
Nmap scan report for 192.168.226.1
Host is up (0.00039s latency).
Not shown: 989 filtered ports
PORT     STATE SERVICE         VERSION
135/tcp  open  msrpc           Microsoft Windows RPC
139/tcp  open  netbios-ssn     Microsoft Windows netbios-ssn
443/tcp  open  ssl/http        VMware VirtualCenter Web service
445/tcp  open  microsoft-ds    Microsoft Windows 7 - 10 microsoft-ds (workgroup: WORKGROUP)
902/tcp  open  ssl/vmware-auth VMware Authentication Daemon 1.10 (Uses VNC, SOAP)
912/tcp  open  vmware-auth     VMware Authentication Daemon 1.0 (Uses VNC, SOAP)
1801/tcp open  msmq?
2103/tcp open  msrpc           Microsoft Windows RPC
2105/tcp open  msrpc           Microsoft Windows RPC
2107/tcp open  msrpc           Microsoft Windows RPC
5357/tcp open  http            Microsoft HTTPAPI httpd 2.0 (SSDP/UPnP)
MAC Address: 00:50:56:C0:00:08 (VMware)
Warning: OSScan results may be unreliable because we could not find at least 1 open and 1 closed port
Aggressive OS guesses: Microsoft Windows Phone 7.5 or 8.0 (94%), Microsoft Windows 10 1607 (93%), Microsoft Windows 10 1511 (93%), Microsoft Windows Server 2008 R2 or Windows 8.1 (93%), Microsoft Windows Vista SP0 or SP1, Windows Server 2008 SP1, or Windows 7 (93%), Microsoft Windows 10 1511 - 1607 (93%), Microsoft Windows Embedded Standard 7 (93%), Microsoft Windows Server 2016 (92%), Microsoft Windows 7 Professional or Windows 8 (92%), Microsoft Windows Server 2008 R2 (91%)
No exact OS matches for host (test conditions non-ideal).
Network Distance: 1 hop
Service Info: Host: AA-COMP; OS: Windows; CPE: cpe:/o:microsoft:windows

OS and Service detection performed. Please report any incorrect results at https://nmap.org/submit/ .
Nmap done: 1 IP address (1 host up) scanned in 79.25 seconds
If you want to do TCP SYN scan use command as follow:
root@thehackertips:~# nmap -sS 192.168.226.1
 Starting Nmap 7.70 ( https://nmap.org ) at 2019-11-03 09:02 EST
 Nmap scan report for 192.168.226.1
 Host is up (0.00043s latency).
 Not shown: 989 filtered ports
 PORT     STATE SERVICE
 135/tcp  open  msrpc
 139/tcp  open  netbios-ssn
 443/tcp  open  https
 445/tcp  open  microsoft-ds
 902/tcp  open  iss-realsecure
 912/tcp  open  apex-mesh
 1801/tcp open  msmq
 2103/tcp open  zephyr-clt
 2105/tcp open  eklogin
 2107/tcp open  msmq-mgmt
 5357/tcp open  wsdapi
 MAC Address: 00:50:56:C0:00:08 (VMware)
 Nmap done: 1 IP address (1 host up) scanned in 17.96 seconds
# -sS TCP SYN scan / Stealth scan / Half-open scan
If you want to get the result faster, It is possible to use T <0-5> parameter on Nmap:
root@thehackertips:~# nmap -T5 192.168.226.1
Sometimes We need to get a list of all the most used ports. In this case, our command will be as below(here we set 10 ports, but you can change that as you want to):
root@thehackertips:~# nmap --top-ports 10 192.168.226.1
Starting Nmap 7.70 ( https://nmap.org ) at 2019-11-03 09:10 EST
Nmap scan report for 192.168.226.1
Host is up (0.00028s latency).
PORT     STATE    SERVICE
21/tcp   filtered ftp
22/tcp   filtered ssh
23/tcp   filtered telnet
25/tcp   filtered smtp
80/tcp   filtered http
110/tcp  filtered pop3
139/tcp  open     netbios-ssn
443/tcp  open     https
445/tcp  open     microsoft-ds
3389/tcp filtered ms-wbt-server
MAC Address: 00:50:56:C0:00:08 (VMware)
Nmap done: 1 IP address (1 host up) scanned in 14.43 seconds
If We want to check only specific port, for example, SMB 445:
root@thehackertips:~# nmap -sT -p445 192.168.226.1
Starting Nmap 7.70 ( https://nmap.org ) at 2019-11-03 09:14 EST
Nmap scan report for 192.168.226.1
Host is up (0.00030s latency).
PORT    STATE SERVICE
445/tcp open  microsoft-ds
MAC Address: 00:50:56:C0:00:08 (VMware)
Nmap done: 1 IP address (1 host up) scanned in 14.64 seconds
# -sT is TCP Connect/ Full scan
To scan UDP port on Nmap:
root@thehackertips:~# nmap -sU 192.168.226.1
Starting Nmap 7.70 ( https://nmap.org ) at 2019-11-03 09:53 EST
Nmap scan report for 192.168.226.1
Host is up (0.00047s latency).
Not shown: 999 open|filtered ports
PORT    STATE SERVICE
137/udp open  netbios-ns
MAC Address: 00:50:56:C0:00:08 (VMware)
Nmap done: 1 IP address (1 host up) scanned in 27.39 seconds
If You want to get verbose (-v) information about the scan with Nmap:
root@thehackertips:~# nmap -v 192.168.226.1
Starting Nmap 7.70 ( https://nmap.org ) at 2019-11-03 10:03 EST
Initiating ARP Ping Scan at 10:03
Scanning 192.168.226.1 [1 port]
Completed ARP Ping Scan at 10:03, 0.04s elapsed (1 total hosts)
Initiating Parallel DNS resolution of 1 host. at 10:03
Completed Parallel DNS resolution of 1 host. at 10:03, 13.01s elapsed
Initiating SYN Stealth Scan at 10:03
Scanning 192.168.226.1 [1000 ports]
Discovered open port 445/tcp on 192.168.226.1
Discovered open port 139/tcp on 192.168.226.1
Discovered open port 443/tcp on 192.168.226.1
Discovered open port 135/tcp on 192.168.226.1
Discovered open port 5357/tcp on 192.168.226.1
Discovered open port 912/tcp on 192.168.226.1
Discovered open port 2103/tcp on 192.168.226.1
Discovered open port 2105/tcp on 192.168.226.1
Discovered open port 2107/tcp on 192.168.226.1
Discovered open port 1801/tcp on 192.168.226.1
Discovered open port 902/tcp on 192.168.226.1
Completed SYN Stealth Scan at 10:03, 3.96s elapsed (1000 total ports)
Nmap scan report for 192.168.226.1
Host is up (0.00093s latency).
Not shown: 989 filtered ports
PORT     STATE SERVICE
135/tcp  open  msrpc
139/tcp  open  netbios-ssn
443/tcp  open  https
445/tcp  open  microsoft-ds
902/tcp  open  iss-realsecure
912/tcp  open  apex-mesh
1801/tcp open  msmq
2103/tcp open  zephyr-clt
2105/tcp open  eklogin
2107/tcp open  msmq-mgmt
5357/tcp open  wsdapi
MAC Address: 00:50:56:C0:00:08 (VMware)
Read data files from: /usr/bin/../share/nmap
Nmap done: 1 IP address (1 host up) scanned in 17.18 seconds
           Raw packets sent: 1990 (87.544KB) | Rcvd: 19 (792B)
Sometimes We need to scan all range but exclude some IP, In this case we can use the command as follow:
root@thehackertips:~# nmap -F 192.168.226.0/24 --exclude 192.168.226.5,192.168.226.10
 Starting Nmap 7.70 ( https://nmap.org ) at 2019-11-03 10:12 EST
 Nmap scan report for 192.168.226.1
 Host is up (0.00041s latency).
 Not shown: 95 filtered ports
 PORT     STATE SERVICE
 135/tcp  open  msrpc
 139/tcp  open  netbios-ssn
 443/tcp  open  https
 445/tcp  open  microsoft-ds
 5357/tcp open  wsdapi
 MAC Address: 00:50:56:C0:00:08 (VMware)
 Nmap scan report for 192.168.226.2
 Host is up (0.000087s latency).
 Not shown: 99 closed ports
 PORT   STATE SERVICE
 53/tcp open  domain
 MAC Address: 00:50:56:E5:0E:0A (VMware)
 Nmap scan report for 192.168.226.129
 Host is up (0.00019s latency).
 Not shown: 82 closed ports
 PORT     STATE SERVICE
 21/tcp   open  ftp
 22/tcp   open  ssh
 23/tcp   open  telnet
 25/tcp   open  smtp
 53/tcp   open  domain
 80/tcp   open  http
 111/tcp  open  rpcbind
 139/tcp  open  netbios-ssn
 445/tcp  open  microsoft-ds
 513/tcp  open  login
 514/tcp  open  shell
 2049/tcp open  nfs
 2121/tcp open  ccproxy-ftp
 3306/tcp open  mysql
 5432/tcp open  postgresql
 5900/tcp open  vnc
 6000/tcp open  X11
 8009/tcp open  ajp13
 MAC Address: 00:0C:29:FA:DD:2A (VMware)
 Nmap scan report for 192.168.226.254
 Host is up (0.000086s latency).
 All 100 scanned ports on 192.168.226.254 are filtered
 MAC Address: 00:50:56:FE:A9:A2 (VMware)
 Nmap scan report for 192.168.226.134
 Host is up (0.000027s latency).
 Not shown: 99 closed ports
 PORT   STATE SERVICE
 22/tcp open  ssh
 Nmap done: 254 IP addresses (5 hosts up) scanned in 30.25 seconds
 root@thehackertips:~#
# Here -F is scan fewer port, not all ports.
Normally When Nmap scans the network it does ping request first and then scans the ports. If we want to skip ping request the command will be as follow:
root@thehackertips:~# nmap -Pn 192.168.226.1
Also, we can check out all interface information with Nmap:
root@thehackertips:~# nmap --iflist
Starting Nmap 7.70 ( https://nmap.org ) at 2019-11-03 10:24 EST
************************INTERFACES************************
DEV  (SHORT) IP/MASK                     TYPE     UP MTU   MAC
eth0 (eth0)  192.168.226.134/24          ethernet up 1500  00:0C:29:4F:E6:9C
eth0 (eth0)  fe80::20c:29ff:fe4f:e69c/64 ethernet up 1500  00:0C:29:4F:E6:9C
lo   (lo)    127.0.0.1/8                 loopback up 65536
lo   (lo)    ::1/128                     loopback up 65536

**************************ROUTES**************************
DST/MASK                     DEV  METRIC GATEWAY
192.168.226.0/24             eth0 100
0.0.0.0/0                    eth0 100    192.168.226.2
::1/128                      lo   0
fe80::20c:29ff:fe4f:e69c/128 eth0 0
::1/128                      lo   256
fe80::/64                    eth0 100
ff00::/8                     eth0 256
To enable OS detection(-O), version detection(-sV), script scanning(-sC), and traceroute (– traceroute) on Nmap We can use [-A]:
root@thehackertips:~# nmap -A 192.168.226.1
Starting Nmap 7.70 ( https://nmap.org ) at 2019-11-03 10:39 EST
Nmap scan report for 192.168.226.1
Host is up (0.00055s latency).
Not shown: 989 filtered ports
PORT     STATE SERVICE         VERSION
135/tcp  open  msrpc           Microsoft Windows RPC
139/tcp  open  netbios-ssn     Microsoft Windows netbios-ssn
443/tcp  open  ssl/http        VMware VirtualCenter Web service
|_http-title: Site doesn't have a title (text; charset=plain).
| ssl-cert: Subject: commonName=VMware/countryName=US
| Not valid before: 2019-03-22T21:23:38
|_Not valid after:  2020-03-21T21:23:38
|_ssl-date: TLS randomness does not represent time
| vmware-version:
|   Server version: VMware Workstation 12.1.1
|   Build: 3770994
|   Locale version: INTL
|   OS type: win32-x86
|_  Product Line ID: ws
445/tcp  open  microsoft-ds    Windows 10 Enterprise 2015 LTSB 10240 microsoft-ds (workgroup: WORKGROUP)
902/tcp  open  ssl/vmware-auth VMware Authentication Daemon 1.10 (Uses VNC, SOAP)
912/tcp  open  vmware-auth     VMware Authentication Daemon 1.0 (Uses VNC, SOAP)
1801/tcp open  msmq?
2103/tcp open  msrpc           Microsoft Windows RPC
2105/tcp open  msrpc           Microsoft Windows RPC
2107/tcp open  msrpc           Microsoft Windows RPC
5357/tcp open  http            Microsoft HTTPAPI httpd 2.0 (SSDP/UPnP)
|_http-server-header: Microsoft-HTTPAPI/2.0
|_http-title: Service Unavailable
MAC Address: 00:50:56:C0:00:08 (VMware)
Warning: OSScan results may be unreliable because we could not find at least 1 open and 1 closed port
Aggressive OS guesses: Microsoft Windows 10 1511 - 1607 (95%), Microsoft Windows 7 Professional or Windows 8 (93%), Microsoft Windows Vista SP0 or SP1, Windows Server 2008 SP1, or Windows 7 (93%), Microsoft Windows 10 1607 (92%), Microsoft Windows 10 1511 (92%), Microsoft Windows Server 2016 (92%), Microsoft Windows Vista SP2, Windows 7 SP1, or Windows Server 2008 (91%), Microsoft Windows 7 (91%), Microsoft Windows Phone 7.5 or 8.0 (91%), Microsoft Windows Server 2008 R2 or Windows 8.1 (90%)
No exact OS matches for host (test conditions non-ideal).
Network Distance: 1 hop
Service Info: Host: AA-COMP; OS: Windows; CPE: cpe:/o:microsoft:windows, cpe:/o:vmware:Workstation:12.1.1

Host script results:
|_clock-skew: mean: -1h20m05s, deviation: 2h18m33s, median: -6s
|_nbstat: NetBIOS name: AA-COMP, NetBIOS user: , NetBIOS MAC: 00:50:56:c0:00:08 (VMware)
| smb-os-discovery:
|   OS: Windows 10 Enterprise 2015 LTSB 10240 (Windows 10 Enterprise 2015 LTSB 6.3)
|   OS CPE: cpe:/o:microsoft:windows_10::-
|   Computer name: AA-COMP
|   NetBIOS computer name: AA-COMP\x00
|   Workgroup: WORKGROUP\x00
|_  System time: 2019-11-03T19:40:39+04:00
| smb-security-mode:
|   account_used: guest
|   authentication_level: user
|   challenge_response: supported
|_  message_signing: disabled (dangerous, but default)
| smb2-security-mode:
|   2.02:
|_    Message signing enabled but not required
| smb2-time:
|   date: 2019-11-03 10:40:39
|_  start_date: 2019-10-29 12:41:34

TRACEROUTE
HOP RTT     ADDRESS
1   0.55 ms 192.168.226.1

OS and Service detection performed. Please report any incorrect results at https://nmap.org/submit/ .
Nmap done: 1 IP address (1 host up) scanned in 141.18 seconds
The Nmap Scripting Engine (NSE) is one of Nmap’s features and there are many commands which used for it. The –script-help shows a description of what each selected script does. Below commands, show all information about the scripts:
root@thehackertips:~# nmap --script-help "*"
NSE scripts define a list of categories as follow: auth, broadcast, brute, default, discovery, dos, exploit, external, fuzzer, intrusive, malware, safe, version, and vuln.
For example vuln – here scripts check for specific known vulnerabilities and generally only report results if they are found and run as follow:
root@thehackertips:~# nmap --script=vuln 192.168.226.1
SCAPY packet manipulation tool: Scapy is a powerful Python-based interactive packet manipulation program.
root@thehackertips:~# scapy
 WARNING: No route found for IPv6 destination :: (no default route?)
 WARNING: IPython not available. Using standard Python shell instead.
 AutoCompletion, History are disabled.
                  aSPY//YASa          apyyyyCY//////////YCa       |         sY//////YSpcs  scpCY//Pp     | Welcome to Scapy
 ayp ayyyyyyySCP//Pp           syY//C    | Version 2.4.0
  AYAsAYYYYYYYY///Ps              cY//S   |
          pCCCCY//p          cSSps y//Y   | https://github.com/secdev/scapy
          SPPPP///a          pP///AC//Y   |
               A//A            cyP////C   | Have fun!
               p///Ac            sC///a   |
               P////YCpc           A//A   | Craft packets like it is your last
        scccccp///pSP///p          p//Y   | day on earth.
       sY/////////y  caa           S//P   |                      -- Lao-Tze
        cayCyayP//Ya              pY/Ya   |
         sY/PsY////YCc          aC//Yp
          sc  sccaCY//PCypaapyCP//YSs
                   spCPY//////YPSps
                        ccaacs
Scapy has a large number of built-in functions and the lsc() command used to list all of that:
>>> lsc()
IPID_count          : Identify IP id values classes in a list of packets
arpcachepoison      : Poison target's cache with (your MAC,victim's IP) couple
arping              : Send ARP who-has requests to determine which hosts are up
bind_layers         : Bind 2 layers on some specific fields' values
bridge_and_sniff    : Forward traffic between interfaces if1 and if2, sniff and                                                                                                                      return
chexdump            :  Build a per byte hexadecimal representation
computeNIGroupAddr  : Compute the NI group Address. Can take a FQDN as input par                                                                                                                     ameter
corrupt_bits        : Flip a given percentage or number of bits from a string
corrupt_bytes       : Corrupt a given percentage or number of bytes from a strin                                                                                                                     g
defrag              : defrag(plist) -> ([not fragmented], [defragmented],
defragment          : defrag(plist) -> plist defragmented as much as possible
dhcp_request        : --
dyndns_add          : Send a DNS add message to a nameserver for "name" to have                                                                                                                      a new "rdata"
dyndns_del          : Send a DNS delete message to a nameserver for "name"
etherleak           : Exploit Etherleak flaw
fletcher16_checkbytes:  Calculates the Fletcher-16 checkbytes returned as 2 byte                                                                                                                      binary-string.
fletcher16_checksum :  Calculates Fletcher-16 checksum of the given buffer.
fragleak            : --
fragleak2           : --
fragment            : Fragment a big IP datagram
fuzz                : Transform a layer into a fuzzy layer by replacing some def                                                                                                                     ault values by random objects
getmacbyip          : Return MAC address corresponding to a given IP address
getmacbyip6         : Returns the MAC address corresponding to an IPv6 address
hexdiff             : Show differences between 2 binary strings
hexdump             :  Build a tcpdump like hexadecimal view
hexedit             : --
hexstr              : --
import_hexcap       : --
is_promisc          : Try to guess if target is in Promisc mode. The target is p                                                                                                                     rovided by its ip.
linehexdump         :  Build an equivalent view of hexdump() on a single line
ls                  : List  available layers, or infos on a given layer class or                                                                                                                      name
neighsol            : Sends an ICMPv6 Neighbor Solicitation message to get the M                                                                                                                     AC address of the neighbor with specified IPv6 address addr
overlap_frag        : Build overlapping fragments to bypass NIPS
promiscping         : Send ARP who-has requests to determine which hosts are in                                                                                                                      promiscuous mode
rdpcap              : Read a pcap or pcapng file and return a packet list
report_ports        : portscan a target and output a LaTeX table
restart             : Restarts scapy
send                : Send packets at layer 3
sendp               : Send packets at layer 2
sendpfast           : Send packets at layer 2 using tcpreplay for performance
sniff               :
split_layers        : Split 2 layers previously bound
sr                  : Send and receive packets at layer 3
sr1                 : Send packets at layer 3 and return only the first answer
sr1flood            : Flood and receive packets at layer 3 and return only the f                                                                                                                     irst answer
srbt                : send and receive using a bluetooth socket
srbt1               : send and receive 1 packet using a bluetooth socket
srflood             : Flood and receive packets at layer 3
srloop              : Send a packet at layer 3 in loop and print the answer each                                                                                                                      time
srp                 : Send and receive packets at layer 2
srp1                : Send and receive packets at layer 2 and return only the fi                                                                                                                     rst answer
srp1flood           : Flood and receive packets at layer 2 and return only the f                                                                                                                     irst answer
srpflood            : Flood and receive packets at layer 2
srploop             : Send a packet at layer 2 in loop and print the answer each                                                                                                                      time
tcpdump             : Run tcpdump or tshark on a list of packets
traceroute          : Instant TCP traceroute
traceroute6         : Instant TCP traceroute using IPv6
traceroute_map      : Util function to call traceroute on multiple targets, then
tshark              : Sniff packets and print them calling pkt.summary(), a bit                                                                                                                      like text wireshark
wireshark           : Run wireshark on a list of packets
wrpcap              : Write a list of packets to a pcap file
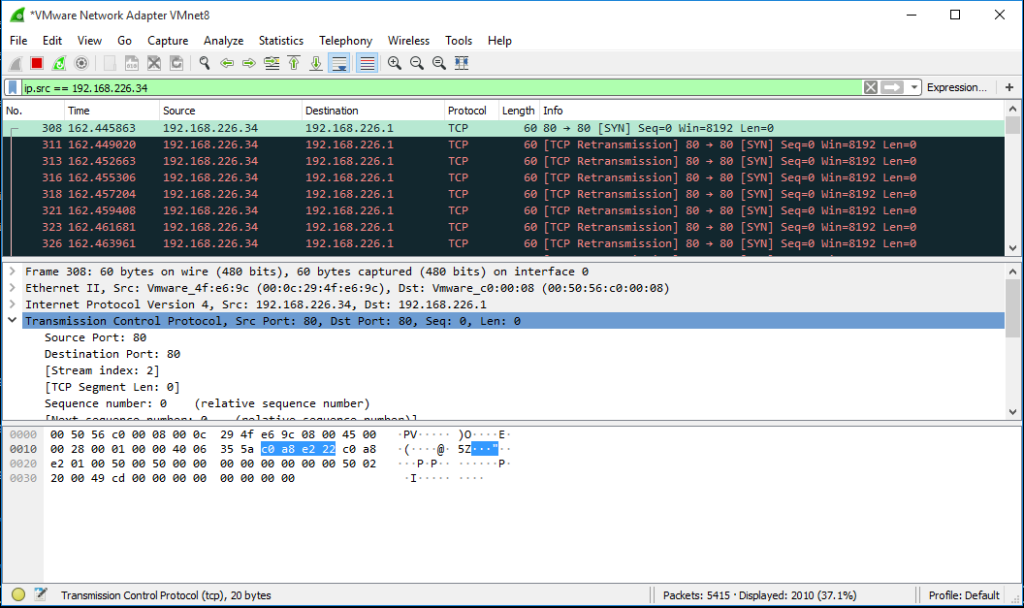
For example, let’s do a DOS attack on the target host. We will use the “send” command for that. Below command, We defined source IP address as src, destination IP address as dst, source port as sport, destination port as dport and number of the packet as count.
>>> send(IP(src="192.168.226.34", dst="192.168.226.1")/TCP(sport=80,dport=80), count=1000)
Result of that command We can see on Wireshark:
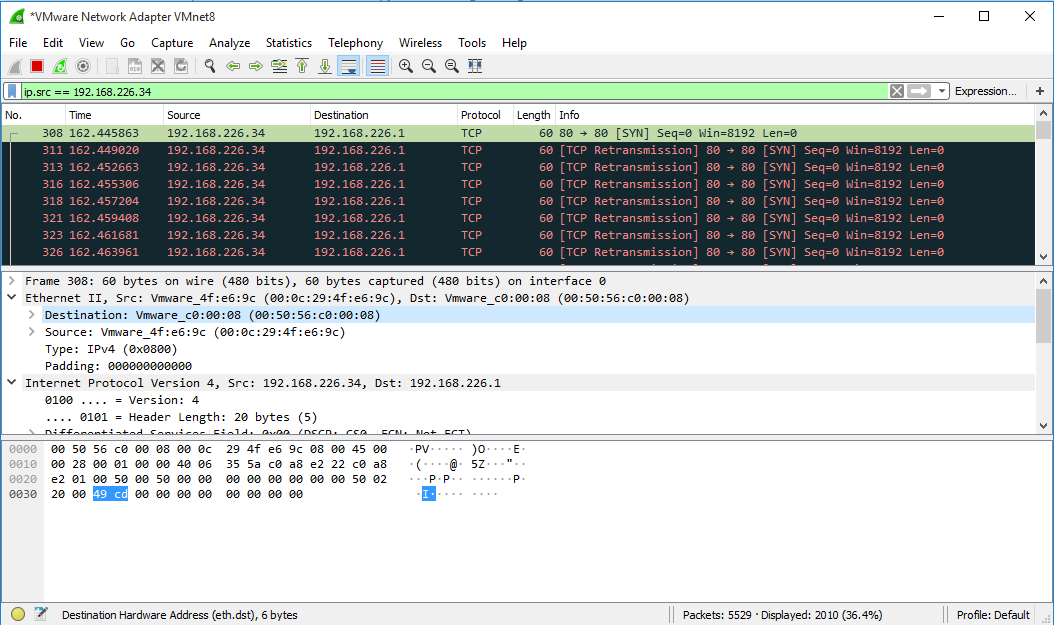
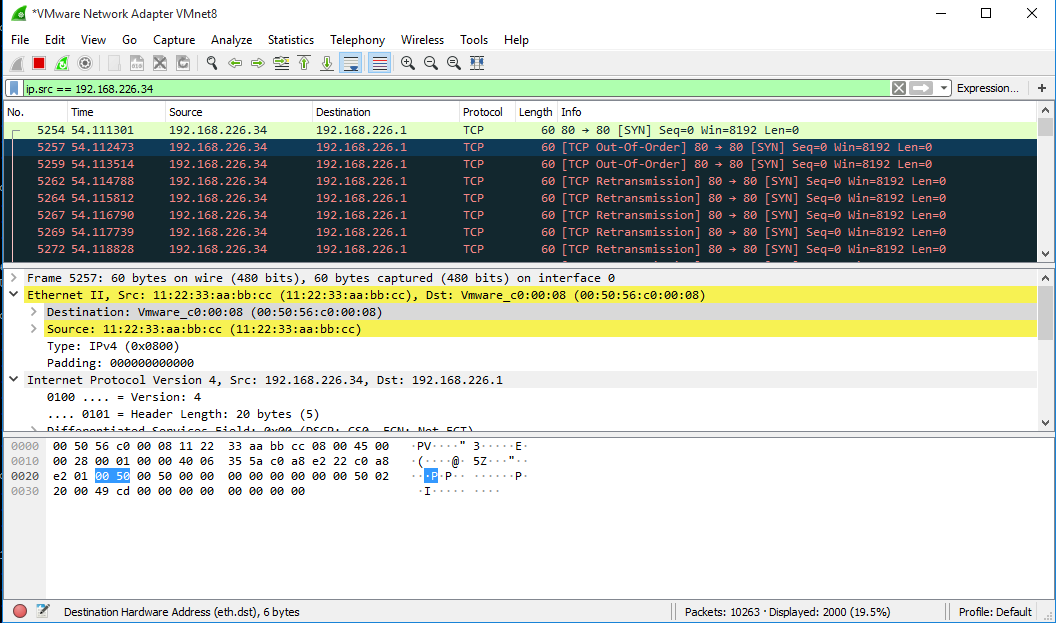
With sendp command, we can spoof the MAC address. To do that command using as follow:
>>> sendp(Ether(src="11:22:33:aa:bb:cc")/IP(src="192.168.226.34", dst="192.168.226.1")/TCP(sport=80,dport=80), count=2000
The result of that on Wireshark You can see the picture as below(before and after MAC address changed):
You can use exit() or Ctrl-D to exit scapy mode.
HPING3 packet analyzer tools: hping is a command-line oriented TCP/IP packet analyzer tool. To look at the help on Kali Linux type command as follow:
root@thehackertips:~# hping3 -h
usage: hping3 host [options]
  -h  --help      show this help
  -v  --version   show version
  -c  --count     packet count
  -i  --interval  wait (uX for X microseconds, for example -i u1000)
      --fast      alias for -i u10000 (10 packets for second)
      --faster    alias for -i u1000 (100 packets for second)
      --flood      sent packets as fast as possible. Don't show replies.
  -n  --numeric   numeric output
  -q  --quiet     quiet
  -I  --interface interface name (otherwise default routing interface)
  -V  --verbose   verbose mode
  -D  --debug     debugging info
  -z  --bind      bind ctrl+z to ttl           (default to dst port)
  -Z  --unbind    unbind ctrl+z
      --beep      beep for every matching packet received
Mode
  default mode     TCP
  -0  --rawip      RAW IP mode
  -1  --icmp       ICMP mode
  -2  --udp        UDP mode
  -8  --scan       SCAN mode.
                   Example: hping --scan 1-30,70-90 -S www.target.host
  -9  --listen     listen mode
IP
  -a  --spoof      spoof source address
  --rand-dest      random destionation address mode. see the man.
  --rand-source    random source address mode. see the man.
  -t  --ttl        ttl (default 64)
  -N  --id         id (default random)
  -W  --winid      use win* id byte ordering
  -r  --rel        relativize id field          (to estimate host traffic)
  -f  --frag       split packets in more frag.  (may pass weak acl)
  -x  --morefrag   set more fragments flag
  -y  --dontfrag   set don't fragment flag
  -g  --fragoff    set the fragment offset
  -m  --mtu        set virtual mtu, implies --frag if packet size > mtu
  -o  --tos        type of service (default 0x00), try --tos help
  -G  --rroute     includes RECORD_ROUTE option and display the route buffer
  --lsrr           loose source routing and record route
  --ssrr           strict source routing and record route
  -H  --ipproto    set the IP protocol field, only in RAW IP mode
ICMP
  -C  --icmptype   icmp type (default echo request)
  -K  --icmpcode   icmp code (default 0)
      --force-icmp send all icmp types (default send only supported types)
      --icmp-gw    set gateway address for ICMP redirect (default 0.0.0.0)
      --icmp-ts    Alias for --icmp --icmptype 13 (ICMP timestamp)
      --icmp-addr  Alias for --icmp --icmptype 17 (ICMP address subnet mask)
      --icmp-help  display help for others icmp options
UDP/TCP
  -s  --baseport   base source port             (default random)
  -p  --destport   [+][+] destination port(default 0) ctrl+z inc/dec
  -k  --keep       keep still source port
  -w  --win        winsize (default 64)
  -O  --tcpoff     set fake tcp data offset     (instead of tcphdrlen / 4)
  -Q  --seqnum     shows only tcp sequence number
  -b  --badcksum   (try to) send packets with a bad IP checksum
                   many systems will fix the IP checksum sending the packet
                   so you'll get bad UDP/TCP checksum instead.
  -M  --setseq     set TCP sequence number
  -L  --setack     set TCP ack
  -F  --fin        set FIN flag
  -S  --syn        set SYN flag
  -R  --rst        set RST flag
  -P  --push       set PUSH flag
  -A  --ack        set ACK flag
  -U  --urg        set URG flag
  -X  --xmas       set X unused flag (0x40)
  -Y  --ymas       set Y unused flag (0x80)
  --tcpexitcode    use last tcp->th_flags as exit code
  --tcp-mss        enable the TCP MSS option with the given value
  --tcp-timestamp  enable the TCP timestamp option to guess the HZ/uptime
Common
  -d  --data       data size                    (default is 0)
  -E  --file       data from file
  -e  --sign       add 'signature'
  -j  --dump       dump packets in hex
  -J  --print      dump printable characters
  -B  --safe       enable 'safe' protocol
  -u  --end        tell you when --file reached EOF and prevent rewind
  -T  --traceroute traceroute mode              (implies --bind and --ttl 1)
  --tr-stop        Exit when receive the first not ICMP in traceroute mode
  --tr-keep-ttl    Keep the source TTL fixed, useful to monitor just one hop
  --tr-no-rtt       Don't calculate/show RTT information in traceroute mode
ARS packet description (new, unstable)
  --apd-send       Send the packet  described with APD (see docs/APD.txt)
As you see on help hping able to send ICMP echo requests and support TCP, UDP, ICMP, RAW-IP protocols. For example, let’s send SYN request to destination port 80:
root@thehackertips:~# hping3 -S www.thehackertips.com -p 80 -c 5
HPING www.thehackertips.com (eth0 66.96.144.191): S set, 40 headers + 0 data bytes
len=46 ip=66.96.144.191 ttl=128 id=20769 sport=80 flags=SA seq=0 win=64240 rtt=151.8 ms
len=46 ip=66.96.144.191 ttl=128 id=20770 sport=80 flags=SA seq=1 win=64240 rtt=151.9 ms
len=46 ip=66.96.144.191 ttl=128 id=20772 sport=80 flags=SA seq=2 win=64240 rtt=150.9 ms
len=46 ip=66.96.144.191 ttl=128 id=20773 sport=80 flags=SA seq=3 win=64240 rtt=150.9 ms
len=46 ip=66.96.144.191 ttl=128 id=20774 sport=80 flags=SA seq=4 win=64240 rtt=149.9 ms

--- www.thehackertips.com hping statistic ---
5 packets transmitted, 5 packets received, 0% packet loss
round-trip min/avg/max = 149.9/151.1/151.9 ms
hping3 can also use the traceroute mode:
 root@thehackertips:~# hping3 --traceroute -V -1 www.thehackertips.com
# -V means verbose
# -1 means ICMP mode | You can look at TCP, UDP and etc mode on help( hping3 -h).
Hping3 also has the ability to send files between a covered channel, and many other features like DDOS flooding attacks.
root@thehackertips:~# hping3 -S 192.168.226.38 -a 192.168.226.1 -p 80 --flood